



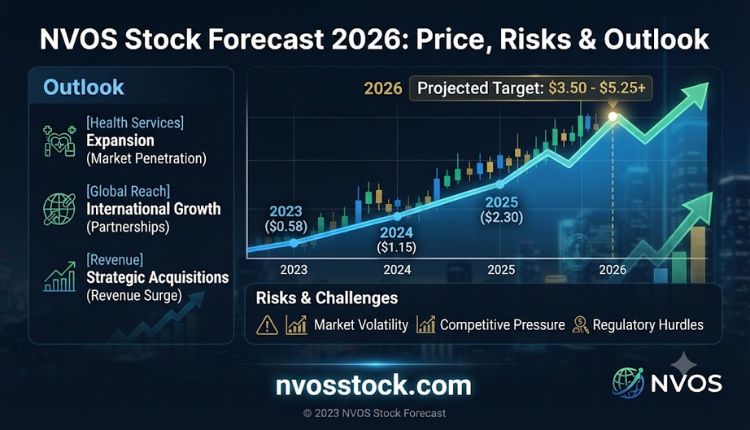
NVOS Stock Prediction 2026–2030: Price Forecast & Analysis

If you’ve spent any time searching “nvos stock prediction,” you’ve probably noticed something odd: every site seems to give you a different number. One model says NVOS is headed toward $1.60. Another says it’s dropping to $0.0003. A third throws around six-figure percentage gains like they’re nothing.
None of that is a typo. It’s just what happens when a stock trades in fractions of a cent — small moves look enormous in percentage terms, and forecasting tools built for normal-priced stocks tend to break down. Before you act on any nvos stock prediction, it helps to understand why the numbers swing so wildly and what’s actually driving Novo Integrated Sciences (NVOS) right now.
What Is NVOS Stock?
Novo Integrated Sciences is a Canada-focused healthcare company. Rather than making a single drug or device, it runs a network of clinics offering physiotherapy, chiropractic care, occupational therapy, concussion management, and related rehabilitation services, alongside a smaller product-sales segment. It’s a real, revenue-generating business — trailing twelve-month revenue sits in the low double-digit millions — but it has also been posting steady net losses, which is a big part of why the stock has struggled.
For a deeper look at the company’s business model and recent share activity, our NVOS stock overview breaks down the fundamentals in plain terms, visit more,
Where the Price Stands Today
NVOS trades over the counter, and its price history over the past year tells the story better than any single quote can: shares have moved from roughly $0.07 down to under a cent, a decline of around 80% over twelve months. Average daily trading volume runs in the tens of millions of shares, which is typical for a low-priced stock where large share counts move for relatively small dollar amounts.
This kind of chart — a steep, sustained downtrend combined with heavy dilution risk — is exactly why long-range price forecasts for NVOS need to be read with a healthy amount of skepticism.
NVOS Stock Prediction: Comparing the Forecasting Models
Different forecasting sites use different methods (technical indicators, historical trend extrapolation, sentiment scoring), and they don’t agree with each other. Here’s a side-by-side look at what several models were projecting recently:
| Forecast Source | Near-Term Outlook | Longer-Term View | Method Used |
| Technical/trend model A | Roughly flat to slightly down over 30 days | Continued decline projected into 2030 | Continued decline projected into 2030 |
| Analyst-style aggregator | Large percentage swings implied (driven by the ultra-low base price) | Wide high/low range, low confidence | Blended technical signals |
| Sentiment-based tracker | Bearish sentiment, “oversold” RSI reading | Model shows further downside by 2030 | Fear & Greed index, momentum indicators |
The takeaway isn’t “which number is right” — it’s that none of these models agree, and that disagreement is itself useful information. When forecasts for the same stock range from a steep decline to a multi-hundred-percent rally within the same calendar year, it’s a signal that the stock is being priced on speculation and momentum rather than fundamentals.
Why NVOS Forecasts Are So Inconsistent
A few structural reasons explain the chaos in any nvos stock prediction you’ll find online:
- Sub-penny pricing distorts percentages: When a stock trades at fractions of a cent, a move of $0.001 can register as a 30–50% swing. Percentage-based forecasts amplify noise.
- Low institutional coverage: NVOS isn’t widely followed by major analyst desks, so most “predictions” come from automated technical models rather than fundamental research.
- Dilution risk: Companies at this price level often need to raise capital through share issuance, which increases share count and pressures price — something pure technical models don’t always account for.
- Thin liquidity spikes: A single large trade can swing the price disproportionately, which then gets baked into short-term momentum models as a “trend.”
If you want more context on how this volatility has played out historically, our earlier piece on navigating NVOS stock’s volatility walks through the pattern in more detail.
Technical Signals Worth Watching
Rather than fixating on a single target price, it’s more useful to track the indicators that actually move NVOS:
- RSI (Relative Strength Index): Readings in oversold territory (typically below 30) suggest selling pressure may be exhausted short-term, though this doesn’t guarantee a reversal for a stock still in a longer downtrend.
- Moving averages: When the short-term average sits well below the longer-term average, it confirms the stock remains in a downtrend rather than a recovery phase.
- Volume trends: Rising volume on down days versus up days tells you whether selling or buying pressure is currently in control.
- Share dilution filings: SEC filings disclosing new share issuances are often a more reliable near-term signal than any technical model.
How to Check Current NVOS Data Yourself
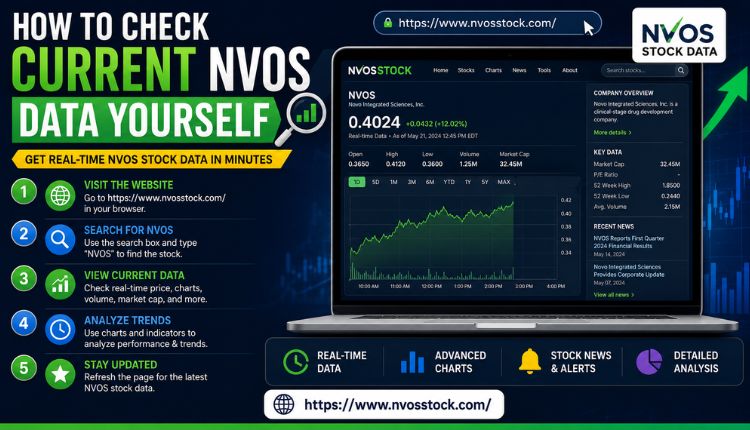
Forecasts age quickly, especially for a stock this volatile. Rather than relying on a static prediction, it’s worth checking live data before making any decision. Our guide on tracking NVOS sentiment via Stocktwits explains how retail sentiment tools can supplement — though never replace — proper research. You can also see how NVOS compares to other frequently searched micro-cap tickers in our comprehensive NVOS overview.
Risks to Weigh Before Trusting Any Prediction
- Reverse split risk: OTC companies trading at these price levels sometimes execute reverse stock splits to meet listing requirements, which can dramatically reset the share price and invalidate older forecasts overnight.
- Going-concern language: Persistent net losses can lead a company’s auditors to flag going-concern risk in filings — always worth checking directly in the latest 10-K or 10-Q.
- No forecasting model predicts news events. Financing announcements, contract wins, or executive changes can move a stock like this far more than any chart pattern.
- Liquidity risk: Getting out of a position isn’t always as easy as getting in, particularly during a sharp move.
None of this is financial advice — it’s a rundown of the factors that make NVOS a genuinely difficult stock to forecast, even for professional models.
FAQs
Is NVOS stock a good investment right now?
That depends entirely on individual risk tolerance. NVOS is a low-priced, thinly covered stock with a history of net losses and heavy price swings — it sits firmly in high-risk, speculative territory rather than a stable long-term holding.
Why do NVOS stock predictions vary so much between websites?
Mostly because of the stock’s ultra-low share price. Small absolute price moves translate into huge percentage swings, and different models weight technical indicators, sentiment, and trend extrapolation differently, producing wildly different-looking targets.
Could NVOS stock go to zero?
It’s a real possibility for any company with sustained losses and dilution pressure, though it’s not guaranteed. This is exactly why diversification and position sizing matter more than chasing a specific predicted price.
What moves NVOS stock price the most?
Financing news, share dilution filings, quarterly earnings, and broader sentiment toward micro-cap healthcare stocks tend to have more impact than long-range technical forecasts.
Where can I find the most current NVOS price data?
Live quotes from your brokerage or a financial data platform will always be more accurate than any published prediction, since forecasts are only as good as the day they were calculated.
Conclusion
Searching for a single, reliable nvos stock prediction is understandable, but the honest answer is that no model — technical, sentiment-based, or otherwise — has a strong track record with a stock this volatile and thinly traded. The more useful approach is tracking the signals that actually drive the price: dilution filings, volume trends, and company news, rather than a specific dollar target for 2026 or 2030.
If NVOS is on your watchlist, treat every forecast as a rough scenario rather than a prediction, check the company’s latest filings before making decisions, and size any position according to how comfortable you’d be if the stock moved sharply in either direction. For ongoing coverage and current data, keep an eye on our NVOS stock hub for updates as new information comes in.