


NVOS Short Interest: Current Data & Squeeze Risk
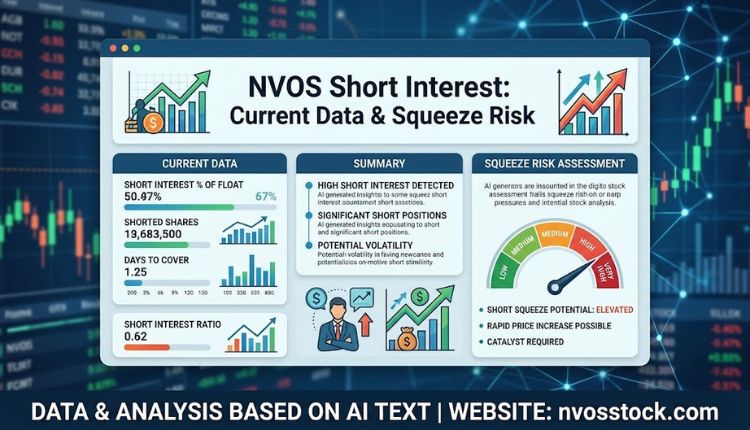
If you’ve been watching NVOS stock, you’ve probably noticed how often the words “short interest” show up next to the ticker. For a low-priced, thinly traded name like Novo Integrated Sciences, short interest isn’t just a background statistic — it’s one of the clearest signals of how traders are positioning against the stock, and how fast that position could unwind.
This guide breaks down what NVOS short interest actually measures, where the numbers currently stand, why they’ve swung so wildly over the past couple of years, and how to read them without getting misled by stale or mismatched data.
What Is Short Interest, Exactly?
Short interest is the total number of shares of a stock that have been sold short and not yet bought back (covered). When a trader shorts NVOS, they’re borrowing shares, selling them at the current price, and betting they can buy them back later at a lower price to return to the lender and pocket the difference.
Short interest is usually reported two ways:
- Raw share count — the actual number of shares currently sold short.
- Percentage of float — short shares divided by the shares available for public trading, which shows how “crowded” the short trade is relative to the stock’s size.
FINRA requires brokers to report short interest twice a month, so the figure you see is never live — it’s a snapshot from the most recent settlement date, typically with a short lag before it’s published, visit more.
Why NVOS Short Interest Numbers Look So Inconsistent
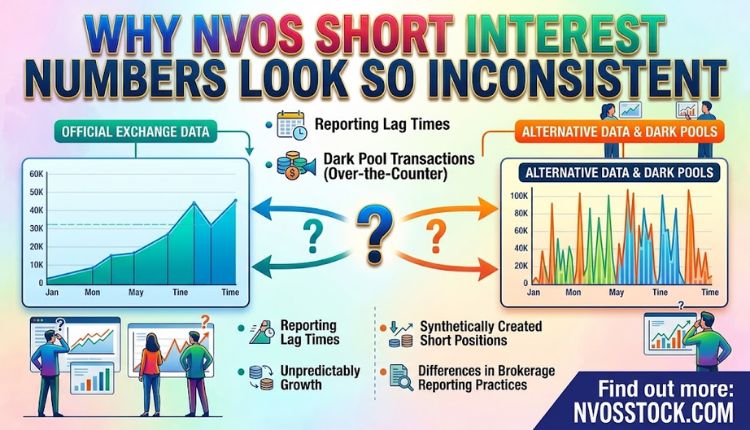
If you check two or three data providers for NVOS short interest, don’t be surprised if the numbers don’t match. There’s a specific reason for that with this stock:
- Multiple reverse splits: Novo Integrated Sciences has gone through more than one reverse split, most notably a 1-for-10 split in November 2023. Any data source that hasn’t fully adjusted its historical figures will show numbers that look completely disconnected from current reality.
- Exchange changes: NVOS has traded on Nasdaq and moved to the OTC markets at different points, and some trackers still have it tagged under an old listing. A short interest percentage calculated against an outdated share count is close to meaningless.
- Extremely low float and price: With a stock trading in fractions of a cent and a market cap in the tens of thousands of dollars in recent sessions, even a small change in shares shorted can swing the percentage dramatically from one report to the next.
The practical takeaway: always check the “as of” date on any short interest figure for NVOS, and treat the percentage of float as more informative than the raw share count.
Latest NVOS Short Interest Snapshot
The table below pulls together the most recent figures from major short interest trackers. Because reporting dates and share-count baselines differ between sources, treat this as a directional snapshot rather than a single “official” number — always click through to a live tracker before making a decision.
| Metric | Reported Figure | Source | As Of |
| Short Interest (shares) | ~100 shares | MarketBeat | September 15, 2025 |
| Percentage of Float Shorted | 0.00% | MarketBeat | September 15, 2025 |
| Days to Cover | 0.0 days | MarketBeat | September 2025 |
| Short Interest (shares, prior methodology) | ~3.46 million | Stock Analysis | Recent filing period |
| Percentage of Float Shorted (prior methodology) | ~2.33% | Stock Analysis | Recent filing period |
| Short Interest % (Benzinga OTC data) | ~1.17% | Benzinga | Recent reporting period |
Why the rows don’t agree: each provider is pulling from a different settlement date and, in some cases, a different share-count base following NVOS’s reverse split. If you’re trading around this data, pull the live figure from a single source rather than averaging across trackers.
How to Read Days to Cover for a Stock Like NVOS
“Days to cover” (also called the short interest ratio) tells you how many trading days it would take for every short seller to buy back their position, based on average daily volume. It’s calculated as:
Days to Cover = Short Interest ÷ Average Daily Trading Volume
A high days-to-cover number generally means shorts would struggle to exit quickly without pushing the price up — the classic setup that fuels a short squeeze. A number near zero, which NVOS has shown in some recent reports, simply means there’s very little short interest relative to how many shares change hands each day. That’s not automatically bullish or bearish; it just means the short side isn’t currently a major force behind the stock’s moves.
What Actually Moves NVOS Short Interest
A handful of factors tend to drive changes in short positioning for a stock like this:
- Dilution events: Convertible notes, warrant exercises, and new share issuances increase the float, which can both invite new short sellers and mechanically shrink the percentage-of-float figure.
- Reverse splits: These reduce the outstanding share count overnight, which resets short interest percentages and can make comparisons to pre-split data unreliable.
- News catalysts: Earnings releases, regulatory filings, or financing announcements can trigger a wave of new shorts or a rush to cover existing ones.
- Borrow availability and cost: If shares become hard to borrow, the borrow fee rate spikes, which can discourage new short positions or force existing shorts to close out.
- Retail and social sentiment: Stocks that get attention on forums like Stocktwits can see short interest swing quickly as sentiment shifts — for context on how that plays out with NVOS specifically, see this breakdown of NVOS Stocktwits sentiment.
Short Interest vs. Short Squeeze Potential
Short interest alone doesn’t tell you whether a squeeze is likely. You generally need a combination of:
- High short interest as a percentage of float
- High days to cover
- Rising borrow fees (a sign shares are getting scarce)
- A catalyst that forces buying pressure — good news, a volume spike, or a technical breakout
With NVOS’s float, price, and volume moving as sharply as they have, short interest data should be read alongside price action rather than in isolation. For a closer look at how volatile the stock’s price history has been, this piece on the volatility behind Novo Integrated Sciences’ stock price is a useful companion read.
Where to Track NVOS Short Interest Yourself
If you want to monitor this data going forward, a few things are worth checking regularly:
- The reporting date — FINRA settlement dates come out twice a month, so figures update on a fixed schedule, not in real time.
- Percentage of float, not just raw shares — the share count alone is meaningless without knowing the float it’s measured against.
- Borrow fee rate — a rising fee is often a leading indicator that short interest is picking up before the official report catches up.
- Cross-reference two sources — given how often NVOS data lags behind reverse splits, checking a second tracker helps catch outdated numbers.
For a broader look at the company behind the ticker before you dig into the trading data, this comprehensive overview of Novo Integrated Sciences covers the business side, and the main NVOS price and analysis page is a good hub for tracking where the stock stands today.
FAQs About NVOS Short Interest
What is the current short interest for NVOS?
It depends on which tracker and reporting date you check, since figures haven’t fully converged after NVOS’s reverse splits and exchange changes. Recent reports have ranged from a small handful of shares shorted up to a few percent of the float, depending on the source and settlement date. Always check the “as of” date before relying on a number.
Why do different websites show different NVOS short interest numbers?
Mainly because of NVOS’s 1-for-10 reverse split in November 2023 and its history of trading on both Nasdaq and OTC markets. Some trackers update their share-count baseline faster than others, which creates mismatched percentages across sites.
Is high short interest bad for NVOS stock?
Not necessarily. High short interest reflects bearish positioning, but it can also set up a short squeeze if the stock catches a positive catalyst and shorts are forced to buy back shares quickly. Low short interest simply means shorting isn’t a major driver of current price action.
How often is NVOS short interest updated?
Short interest is reported to FINRA twice a month, on a set settlement schedule. It is not a real-time figure, though some data providers offer intraday estimates of shares available to borrow, which is a different metric from official short interest.
Where can I find NVOS’s borrow fee rate?
Short interest trackers that specialize in real-time data typically publish a borrow fee rate alongside short interest and shares available to short. This is updated far more frequently than the official short interest report and can be a useful early signal.
Does short interest affect NVOS’s share price directly?
Short interest itself doesn’t move the price — but the buying pressure created when shorts cover their positions can. That’s the mechanism behind a short squeeze, and it’s why traders watch days-to-cover alongside volume trends.
Conclusion
NVOS short interest is a genuinely useful data point, but it comes with more noise than most stocks because of the company’s reverse split history and its moves between exchanges. Rather than fixating on a single percentage from a single source, the more reliable approach is to check the reporting date, compare the percentage of float across a couple of trackers, and watch the borrow fee rate for early signs of a shift. Paired with the stock’s broader price and volume trends, that gives a far clearer picture than any one short interest number on its own.