

VENG Stock Price Prediction: What The Data Really Shows
Search “VENG stock price prediction” and you’ll find a mix of forecast calculators, AI-generated price targets, and OTC forums throwing around numbers with no real backing. Before trusting any of that, it helps to know what VENG actually is right now, because that changes the entire conversation around forecasting it.
VENG is the ticker for Vision Energy Corporation, a small energy infrastructure company that trades (or traded) on the OTC markets. As of the most recent data available, the stock is inactive, with its last recorded trade sitting at a fraction of a cent. That single fact matters more than any chart pattern or moving average, and it’s the first thing to understand before looking at any prediction, visit more.
This guide walks through VENG’s background, its price history, why standard forecasting methods don’t really apply here, and what to check before you draw any conclusions of your own.
What Is VENG Stock?
Vision Energy Corporation was formerly known as Vision Hydrogen Corporation and changed its name in November 2022. The company describes itself as a developer of midstream infrastructure for importing, storing, and distributing low-carbon energy products, including hydrogen carriers, with a focus on facilities in the Netherlands and, at one point, plans to relocate its headquarters to London.
Here’s the snapshot:
| Detail | Information |
| Company name | Vision Energy Corporation (formerly Vision Hydrogen Corp) |
| Ticker | VENG |
| Exchange | OTC Markets (OTCQB/OTC Pink, history varies) |
| Sector | Utilities – Renewable / Energy Infrastructure |
| Headquarters | Jersey City, New Jersey |
| Founded | 2015 |
| Ticker change | Switched from VIHDD to VENG in December 2022 |
| Corporate action | 1-for-5 reverse stock split announced June 2023 |
| Trading status | Inactive, last recorded trade near $0.0015 |
| 52-week range (last active period) | $0.0001 – $0.20 |
A stock at this stage of its life cycle behaves nothing like a large-cap or even a typical growth stock, and any “prediction” needs to be read with that context front and center.
VENG’s Price History: A Timeline of Decline
VENG’s story is fairly typical of a micro-cap energy hopeful that never found consistent revenue or investor confidence:
- 2022 – The company rebrands from Vision Hydrogen to Vision Energy and changes its ticker to VENG. Press releases describe ambitious plans for low-carbon fuel terminals in Europe.
- Early 2023 – Vision Energy files environmental assessments and announces engineering progress on its Dutch energy hub projects. Shares trade at low single-digit-cent to low-dollar levels depending on the split adjustment.
- June 2023 – The company executes a 1-for-5 reverse stock split, a move companies typically use to prop up a falling share price and avoid exchange or market-tier issues.
- Mid-to-late 2023 – Plans surface to relocate headquarters to London, alongside continued permitting and project updates.
- 2024–2025 – Trading volume thins out considerably. Filings become sparser, and coverage from major financial data providers starts flagging the stock as delisted or inactive.
- 2025 onward – The last recorded trade sits at roughly $0.0015, with a 52-week range as low as $0.0001. Market capitalization is measured in the thousands of dollars rather than millions.
That trajectory- a rebrand, a reverse split, thinning volume, and an eventual halt in active trading- is the pattern investors should recognize before treating this as a normal forecasting exercise.
Why “veng stock price prediction” Doesn’t Work the Same Way for VENG
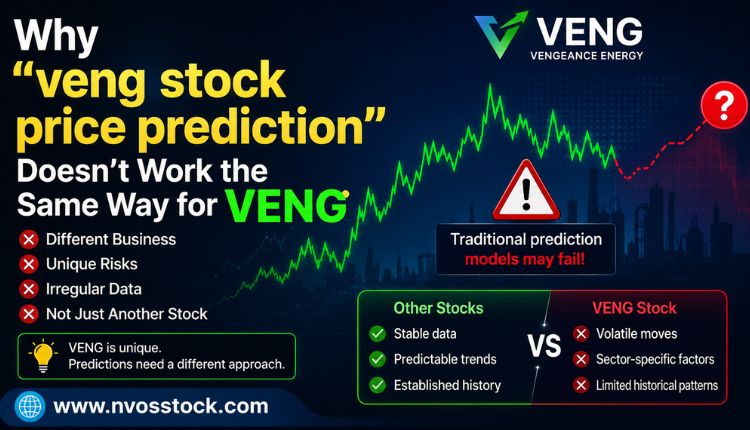
Most stock price prediction content leans on technical indicators, analyst price targets, or AI models trained on historical price movement. None of those tools function properly here, for a few concrete reasons:
No active market: Price prediction assumes continuous trading with enough volume to reflect genuine supply and demand. When a stock is inactive or trading only a few hundred shares occasionally, the “price” isn’t really discovering value; it’s just the last print.
No analyst coverage: Wall Street price targets come from institutions that cover a stock because clients hold it in size. Micro-cap OTC names like VENG typically have zero analyst coverage, so there’s no consensus estimate to point to.
Thin or absent financial reporting: Reliable forecasting depends on revenue trends, earnings, and forward guidance. Vision Energy’s public filings show minimal or negative revenue and heavy losses, which makes discounted cash flow or earnings-multiple models close to meaningless.
History of dilution and reverse splits: Reverse splits reduce share count without changing the underlying business, and they’re frequently followed by further declines once the artificial price boost wears off. That pattern shows up again and again in penny stocks and OTC names.
Delisting risk and status changes: A stock already flagged as inactive can be reactivated, delisted outright, or reorganized under a new entity. Any of those events would make historical price data irrelevant overnight.
Given all of that, a specific dollar-and-cents prediction for VENG isn’t something that can be responsibly offered. What can be offered is a framework for what to actually check.
What To Check Before Forming Any View on VENG
If you’re researching VENG specifically, or any dormant OTC ticker, work through these checks rather than relying on a single forecast number:
- Confirm current trading status: Check the OTC Markets website directly and search the ticker to see whether it’s marked active, “Expert Market,” or no longer quoted.
- Read the latest SEC filings: Search EDGAR for the company’s CIK number and review the most recent 10-K, 10-Q, or 8-K for updates on operations, cash position, and going-concern language.
- Look for corporate action history: Reverse splits, name changes, and ticker changes (like VIHDD to VENG) all affect how historical charts should be interpreted.
- Check share count and dilution trends: Rising shares outstanding without matching revenue growth is a common warning sign in this category of stock.
- Verify news through primary sources: Press releases distributed through GlobeNewswire or similar wires should be cross-checked against actual regulatory filings, not just headlines.
- Understand liquidity risk: Even if you could buy shares, extremely low volume means you might not be able to sell at any reasonable price when you want to.
Working through similar situations for other tickers can help build the habit. For a case study in how a name-and-symbol shift plays out for investors, the breakdown of NVOS: Novo Integrated Sciences Price & Analysis covers a comparable set of questions. The companion piece on NVOS stock price and analysis walks through similar volatility patterns in more depth, and the deeper dive into Novo Integrated Sciences’ stock price volatility is worth a read if you want to see how one small-cap’s price swings unfolded over time.
Sentiment Data: A Supplement, Not a Substitute
For actively traded micro-caps, retail sentiment trackers like Stocktwits can offer a rough read on how a crowd of traders is leaning, though sentiment isn’t the same thing as a price forecast. If you’re comparing VENG’s situation against other small or thinly traded names, the sentiment breakdowns for TRKA on Stocktwits and GNS sentiment versus NVOS stock show how these trackers get used in practice. There’s also a dedicated look at NVOS stock sentiment on Stocktwits that’s useful for understanding the limits of crowd-sourced data on low-volume names.
For a stock in VENG’s current state, with trading effectively paused, sentiment data has even less to work with than usual, since there’s barely a crowd left discussing it actively.
VENG Stock Snapshot
| Metric | Value |
| Last trade price | ~$0.0015 |
| Market capitalization | ~$12.6K |
| 52-week range | $0.0001 – $0.20 |
| Shares outstanding | ~8.43 million |
| Net income (TTM) | Approximately -$16.5 million |
| EPS | Approximately -$1.97 |
| Beta | Extremely high (54.93), reflecting erratic historical price swings |
| Analyst coverage | None |
| Dividend | None |
These figures move around as new data comes in and as filings update, so always confirm against a live source like OTC Markets or EDGAR rather than treating any snapshot as current.
Frequently Asked Questions
Is VENG stock still trading?
Based on the most recent data available, VENG shows as inactive, with its last recorded trade at a fraction of a cent. Status can change, so check OTC Markets directly for the current listing state before assuming anything.
What happened to VENG stock?
Vision Energy Corporation (formerly Vision Hydrogen Corp) went through a rebrand, a ticker change from VIHDD to VENG, and a 1-for-5 reverse stock split in 2023. Trading volume declined steadily afterward, and the company’s public filings show heavy losses with limited revenue, which coincided with the stock becoming inactive.
Can anyone accurately predict VENG’s future price?
Not with any real confidence. Reliable price prediction depends on active trading, analyst coverage, and consistent financial reporting, none of which currently apply to VENG. Anyone offering a specific price target for a stock in this condition is guessing, not forecasting.
Is VENG stock a good investment?
That’s a personal decision that depends on your risk tolerance, and it isn’t something a general guide can answer for you. Given the inactive trading status, minimal revenue, and lack of analyst coverage, this falls firmly into high-risk, speculative territory. Anyone considering it should read the company’s actual SEC filings and, ideally, talk to a licensed financial advisor first.
Where can I check VENG’s real-time status?
OTC Markets Group’s website and SEC EDGAR are the two most reliable direct sources. Third-party finance sites can lag or carry outdated data for low-volume tickers like this one.
How does VENG compare to other small-cap or OTC stocks?
The pattern- a rebrand, a reverse split, and a slide toward inactivity- isn’t unique to VENG. Similar trajectories show up across the OTC market, which is part of why comparing notes across tickers like NVOS or checking forecasts for larger, actively covered names like Novo Nordisk can help put a stock like VENG’s situation in perspective.
Conclusion
The honest answer to “VENG stock price prediction” is that there isn’t a reliable one to give right now. The stock is inactive, coverage is nonexistent, and the underlying company’s financials don’t support the kind of modeling that goes into a legitimate forecast. What matters more than a made-up price target is knowing how to check the facts yourself: current trading status on OTC Markets, the latest filings on EDGAR, and the corporate action history that explains how VENG got here in the first place.
If you’re tracking VENG because you already hold shares, or you’re evaluating it as a speculative watch-list name, treat any number you see online, including anything generated by an AI tool, as a guess dressed up as an analysis. Do the primary-source homework first.